Eye Diagram and BER
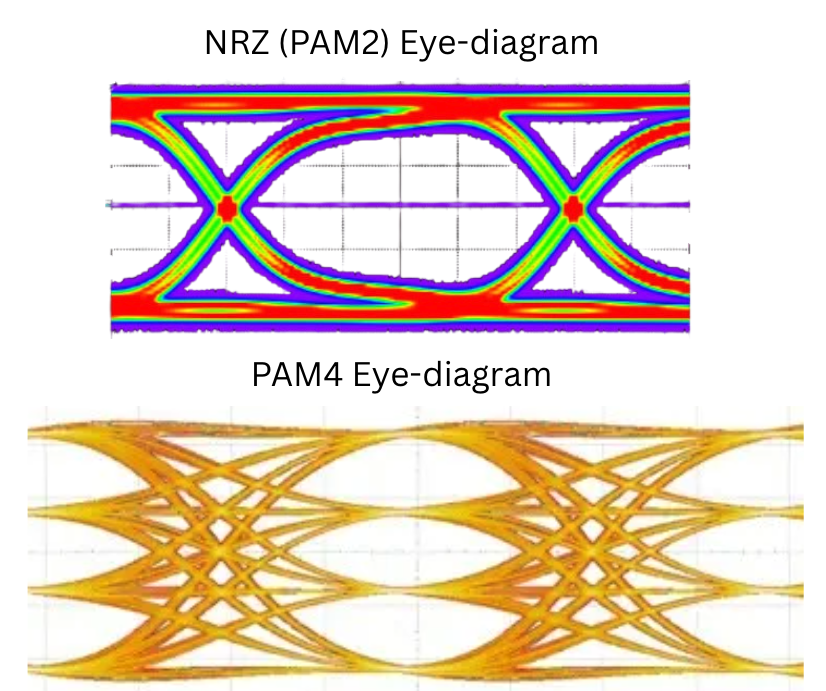
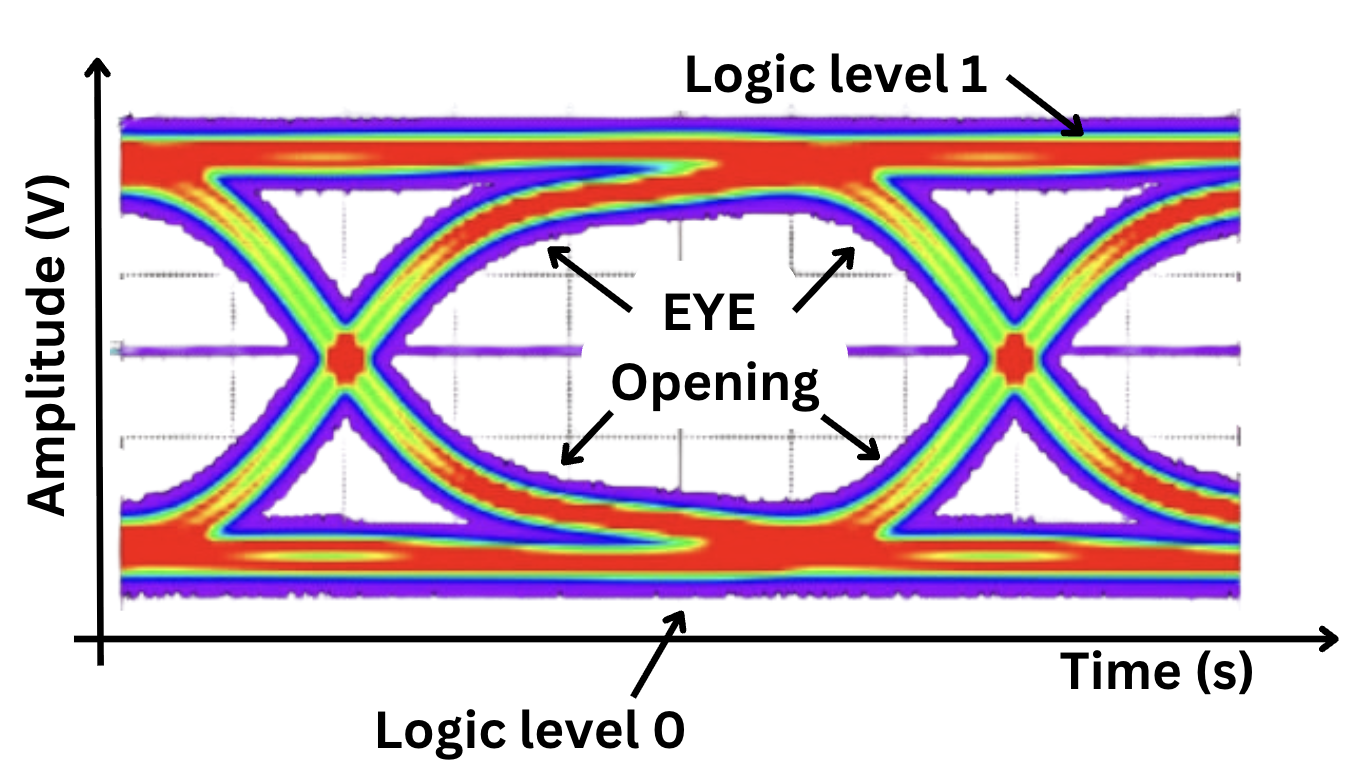
An eye diagram or eye pattern is created by overlaying thousands of cycles of a digital signal onto a single screen. It shows all possible transitions (0-to-1, 1-to-0, 0-to-0, and 1-to-1) on top of each other. Eye diagram are more relevant for wireline communication systems like USB, PCIe, Ethernet.
Eye Diagram Properties
To construct an eye diagram, the signal is wrapped back onto itself at periodic time intervals, retaining all traces. It is measured using high speed oscilloscopes. The oscilloscope is triggered by the system clock.
Bit Period
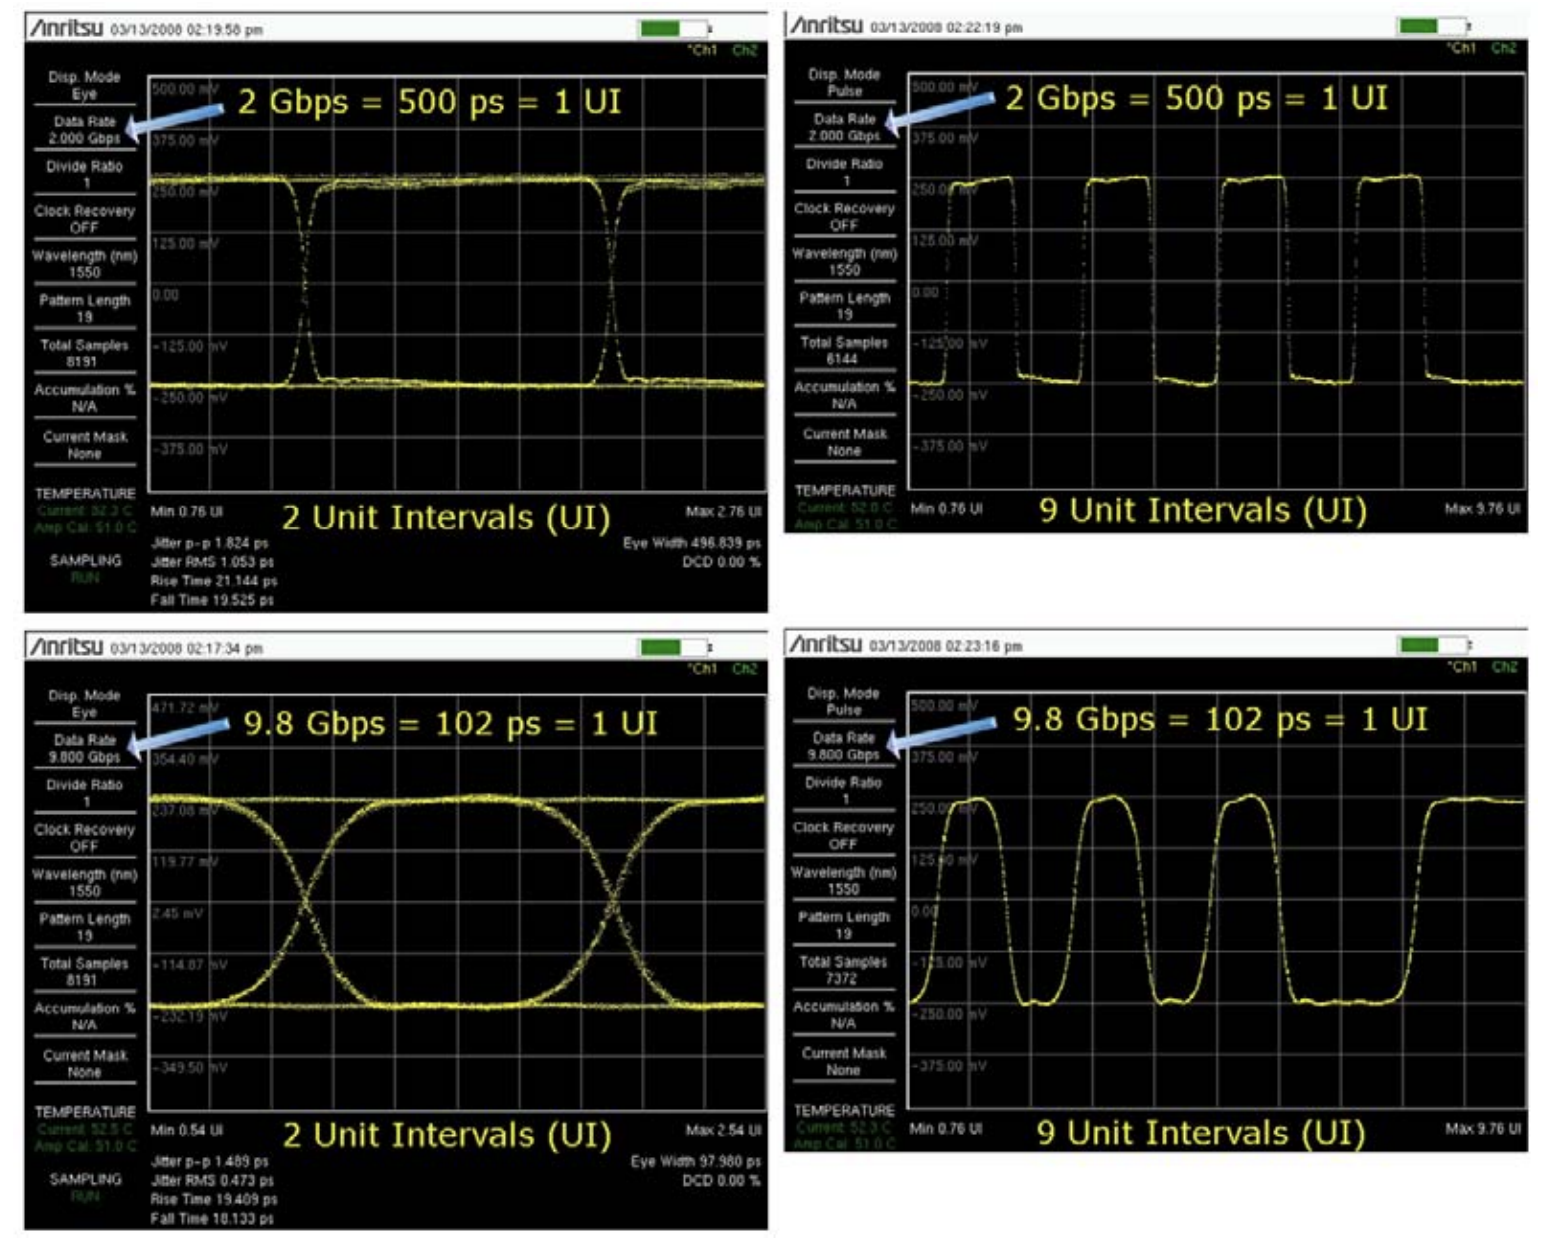
The total time allocated for a single bit (e.g., 100-ps for a 10-Gbps signal). It is the horizontal distance from the start of one bit to the start of the next.
Unit Interval (UI)
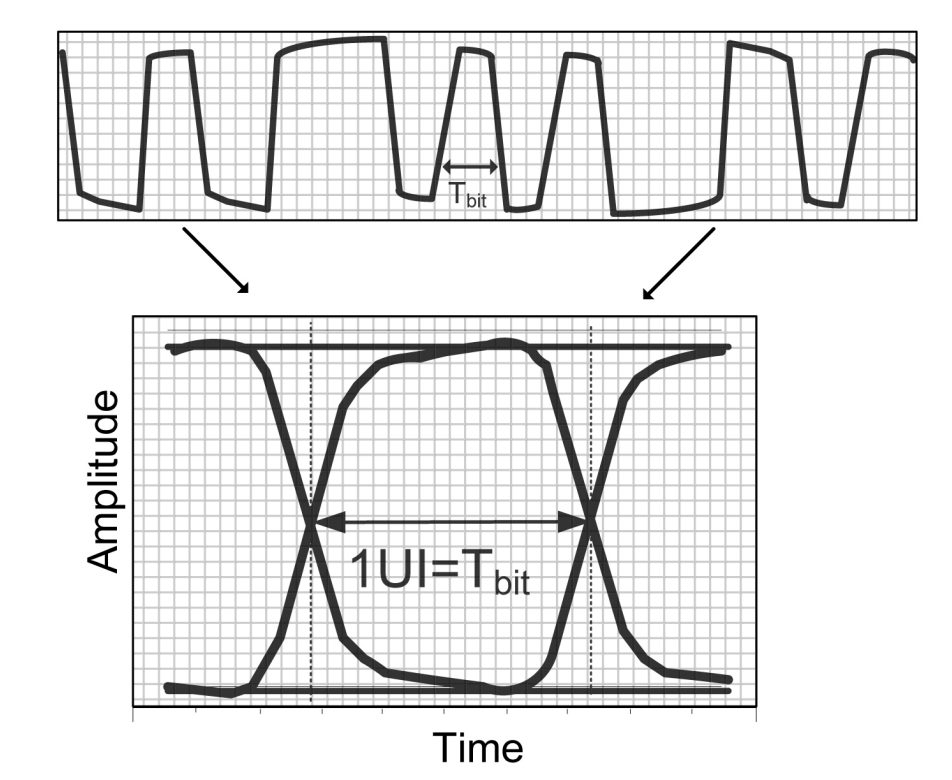
A normalized measure of the bit period. Engineers often use 1 UI instead of a specific time (like 500ps) to describe signal features independently of the data rate.
Sampling Instant
The specific point in time (usually the center of the eye) where the receiver decide if the bit is a 0 or a 1.
Timing Margin
The "slack" or extra time available between the signal transition (edge) and the required sampling point. A larger margin means the system is more resistant to jitter.
Timing Window
The total horizontal duration during which the signal remains at a valid logic level.
One Level
In an eye diagram, the one level represents the average voltage of a logic ‘1’. This value is typically computed from the histogram mean of all data samples captured within the central portion of the eye period—commonly the middle 20% (from 40% to 60% of the unit interval), where the signal is most stable.
Zero Level
The zero level in an eye pattern is the mean value of a logic zero. The zero level is computed from the same 40 to 60% region of the baseline area during the eye period as the one level.
Eye Opening
The clear area in the center of the diagram where no signal traces pass. A "wide open" eye represents a high-quality signal.
Eye Closure
Eye closure is the reduction of the eye's opening (vertical and/or horizontal). It is caused by noise, jitter, and inter-symbol interference (ISI). As the eye closes, the Bit Error Rate (BER) increases.
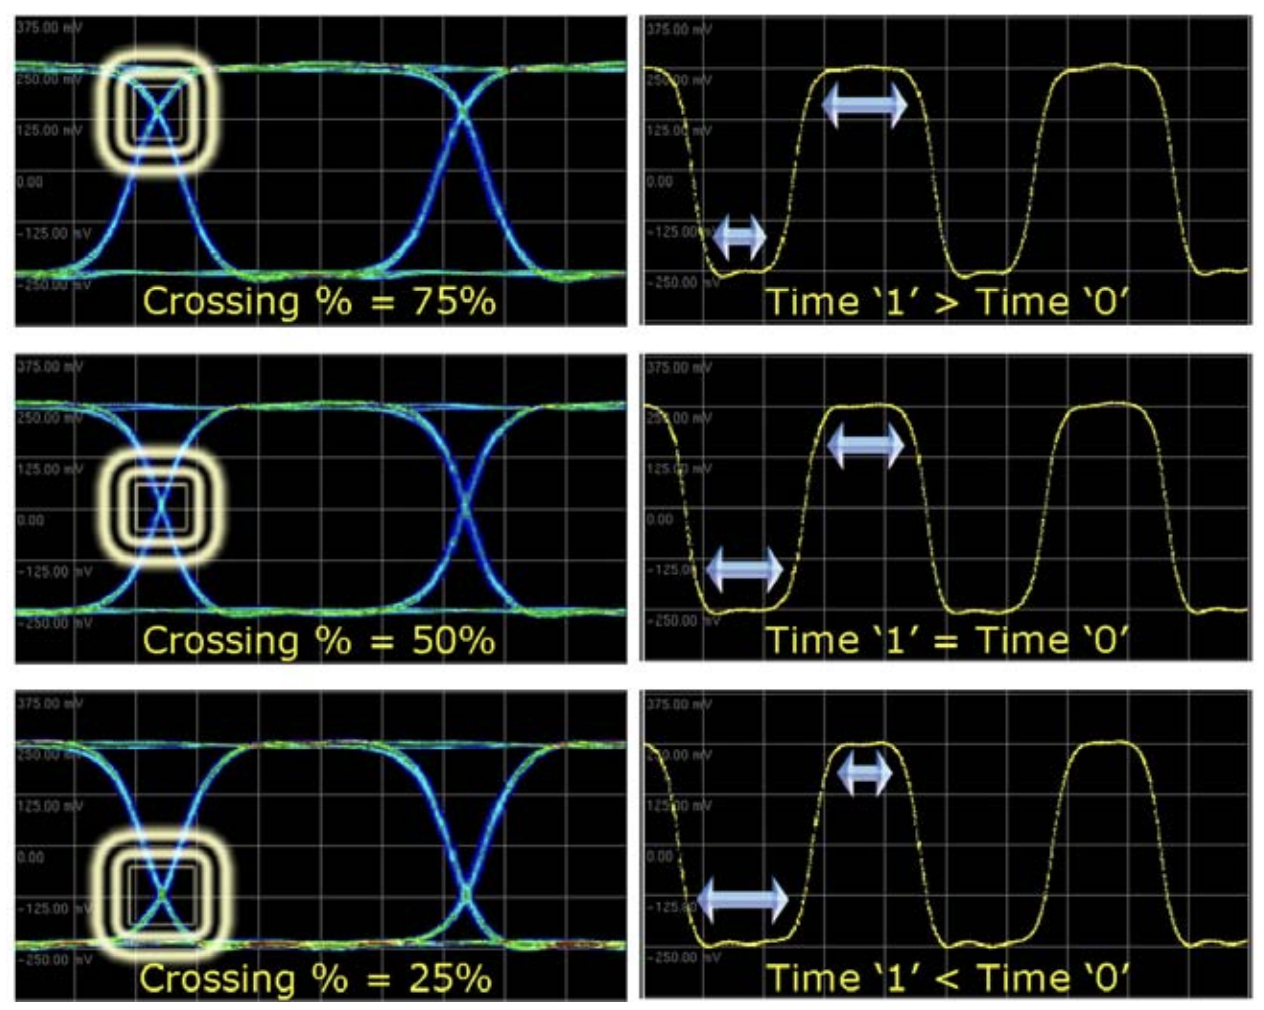
Crossing Point
The intersection where the rising and falling edges of the signal meet. Ideally, this occurs at 50% of the eye amplitude. Shifts in this point indicate duty-cycle distortion.
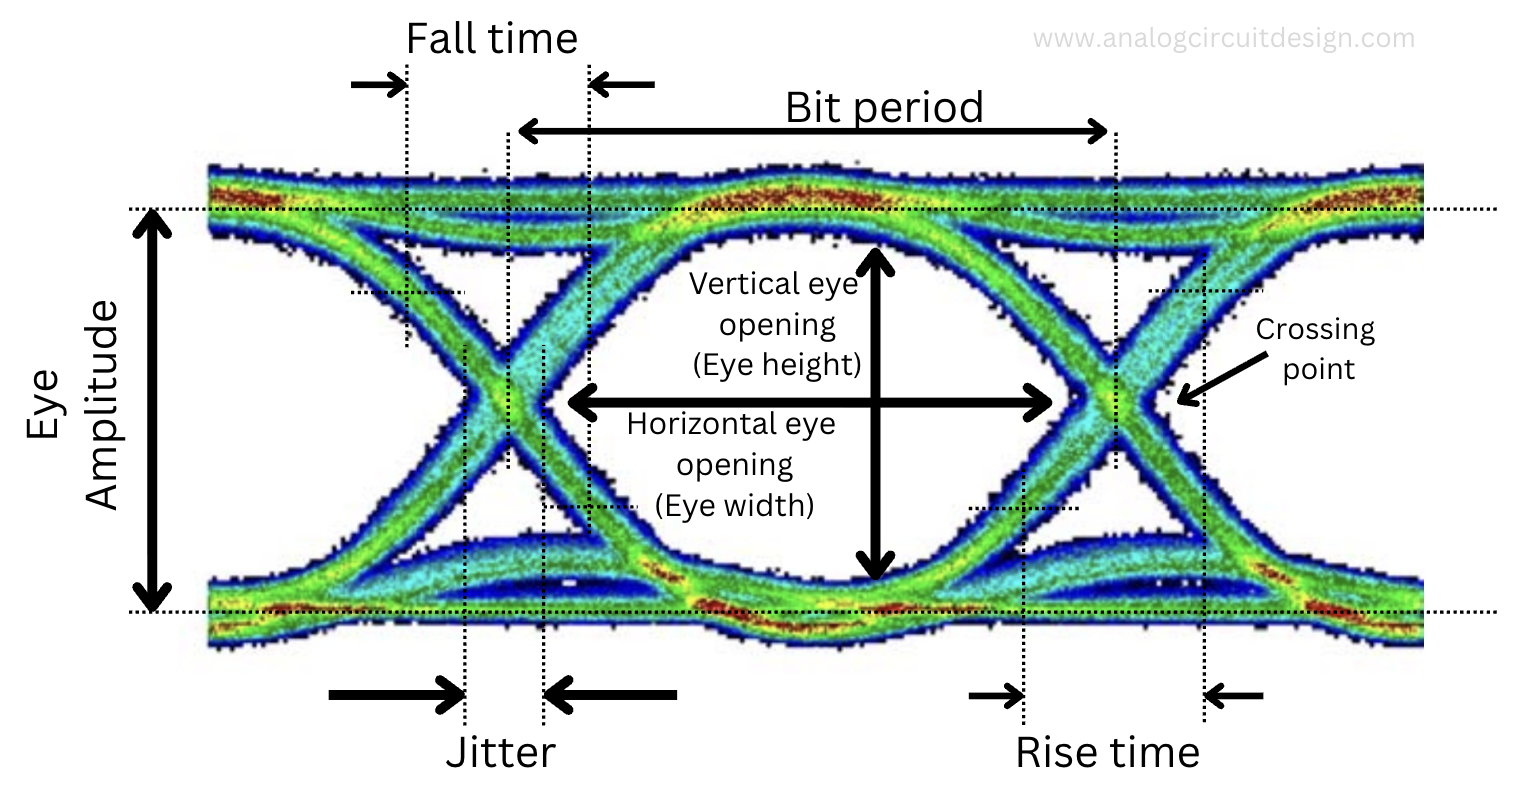
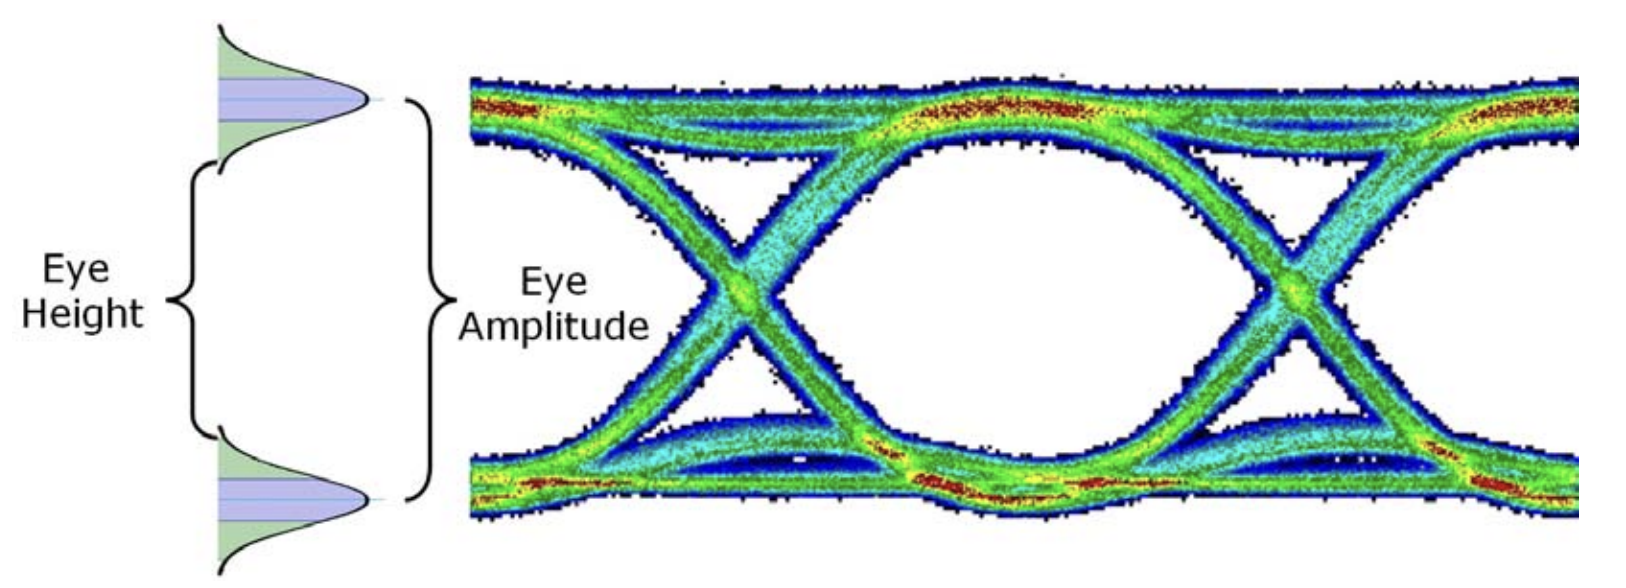
Eye Height
Eye height is the vertical opening of the eye. It represents the noise margin (the voltage difference between a 0 and 1). A smaller height indicates ISI (intersymbol interference).
Eye Width
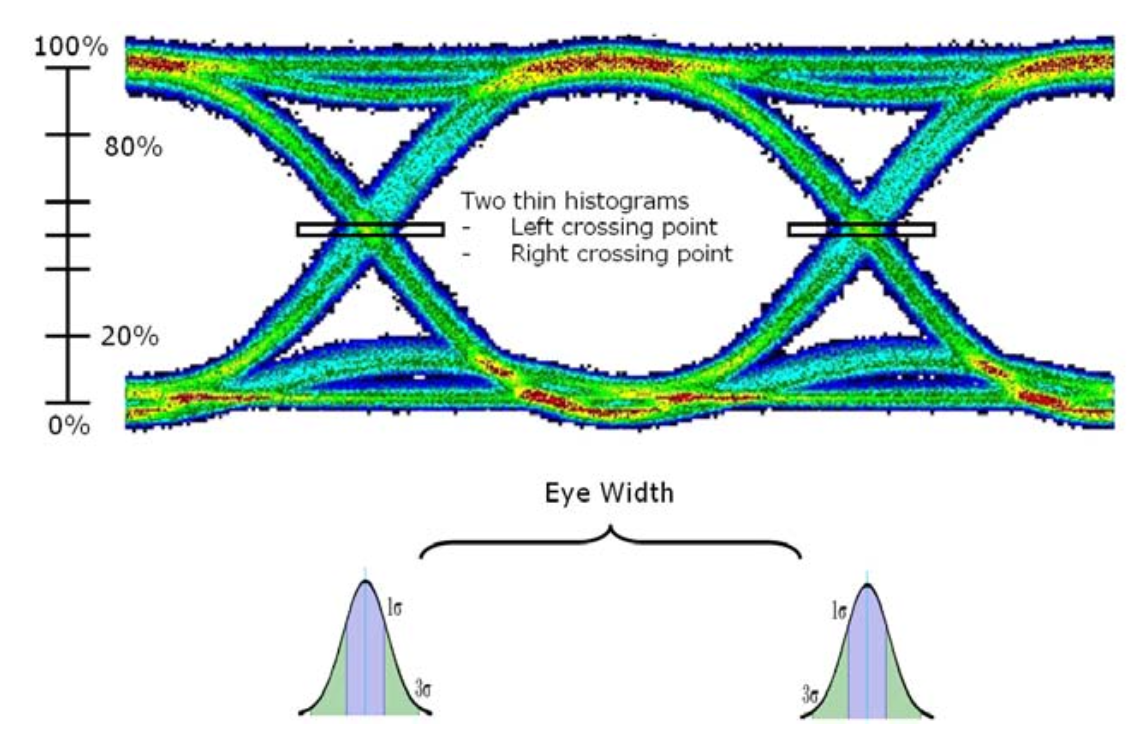
Eye width is the horizontal opening of the eye at a specific voltage threshold. The threshold is usually the 50% of the eye amplitude. It indicates the available time for sampling and is directly reduced by timing jitter. Higher eye width is desirable.
Eye Crossing Percentage
The crossing level is the mean value of a thin vertical histogram window centered on the crossing point of the eye diagram. The eye crossing percentage is then calculated using the following equation:
$$\text{Eye crossing %}=\cfrac{\text{Crossing level}-\text{Zero level}}{\text{One level}-\text{Zero level}}\times{}100$$
Eye crossing percentage gives an indication of duty cycle distortion or pulse symmetry problems in the high speed data.
Eye amplitude
The eye amplitude is defined as the difference between the one level and the zero level. The one and zero levels correspond to the mean values obtained from the histogram at the point of maximum eye opening, representing the highest eye height. Quantitatively, eye height is derived from computing the difference between the inner 3σ points on the inside of the histograms of the one and zero levels.
Jitter
Jitter is the deviation in time from the ideal occurrence of a data-bit transition and is one of the most critical considerations in high-speed digital data systems. More about Jitter - Clock Jitter.
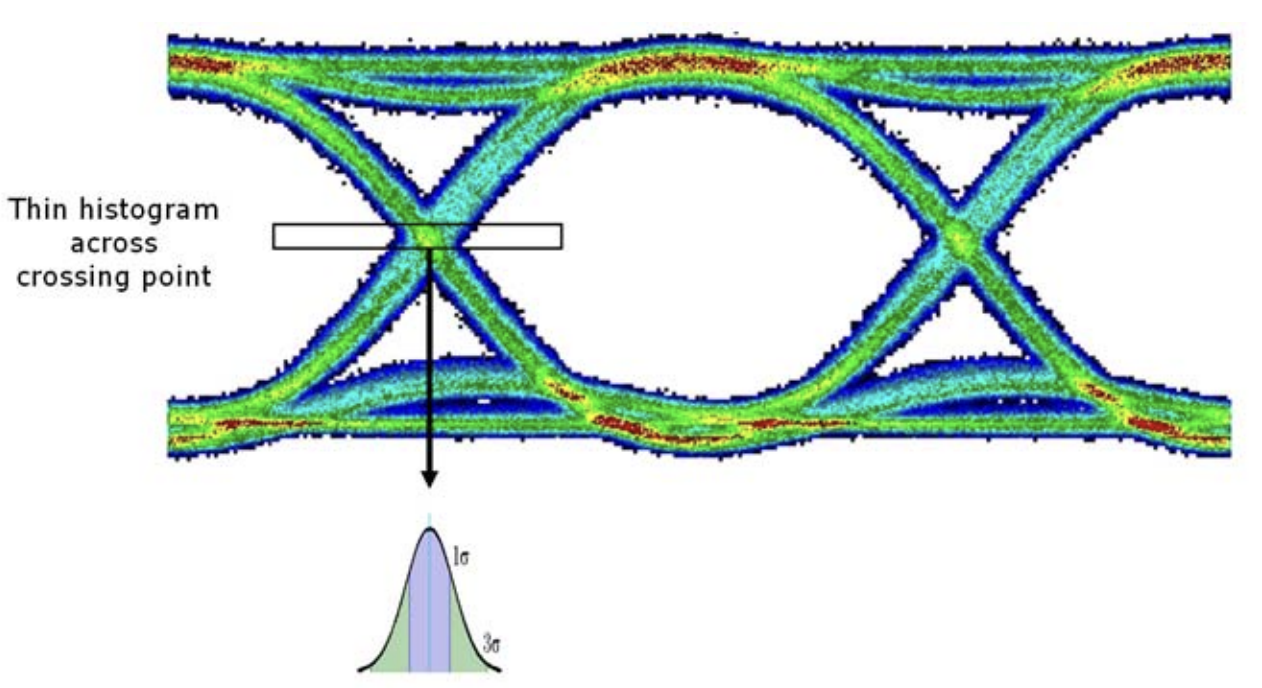
To measure jitter, the timing variations of the rising and falling edges at the eye-diagram crossing point are captured. These fluctuations may be random, deterministic, or a combination of both. A time histogram of the crossing points is then generated and analyzed to quantify jitter. Peak-to-peak jitter is defined as the full width of the histogram, encompassing all observed data points, while RMS jitter is defined as the standard deviation of the histogram.
Channel Skew
Channel skew refers to the small amount of time difference the individual channels have.
Bathtub Curve and BER from Eye Diagram
Engineers often use a "Bathtub Curve" to visualize this relationship. It plots the BER (Bit error rate) as a function of the sampling time across the eye. As we move away from the mean crossing point, the BER reduces.
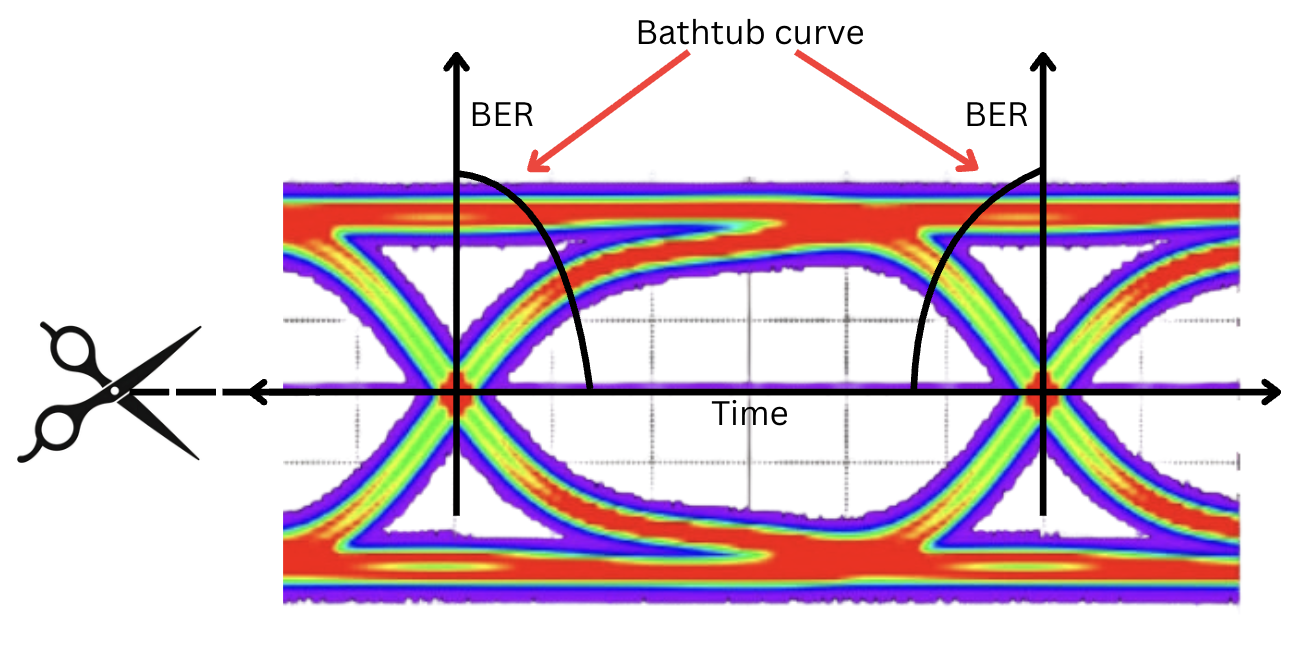
Bathtub curve is generating by slicing the eye diagram as shown above.
Data Eye Mask
The quality of a high speed digital signal can be quickly determined by using a compliance mask overlay on the eye diagram display. A typical mask includes both time and amplitude limits. This allowable region is known as the data eye mask, and signal traces must remain outside the mask to ensure reliable data detection.
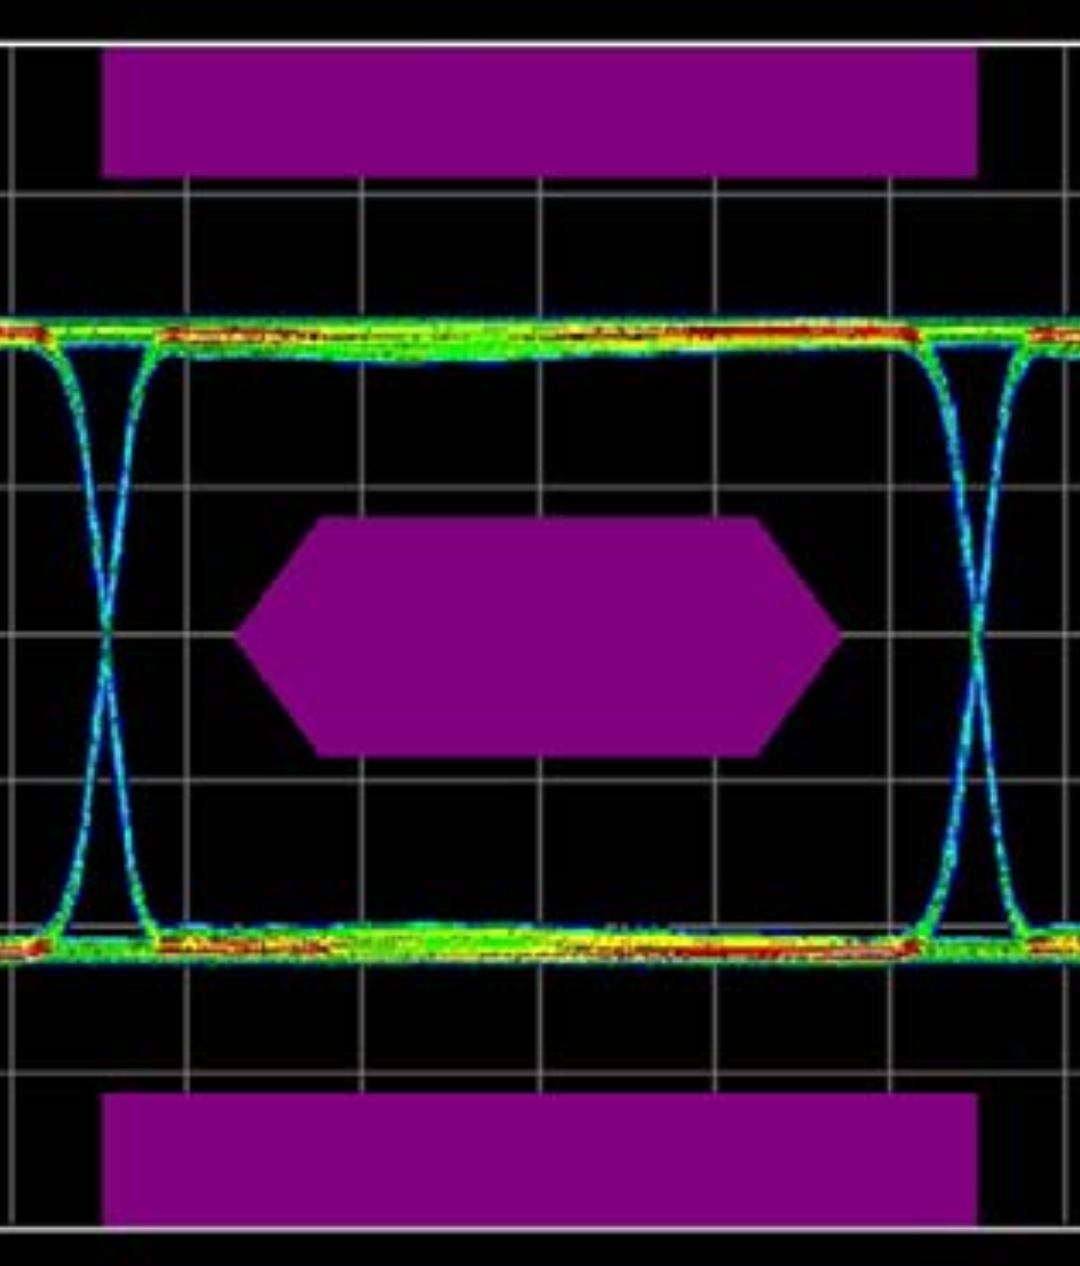
In the above diagram, the magenta block inside represent “keep-out” areas. In order to pass the mask compliance test, the transmitter output must not have ANY samples fall within the “keep-out” regions.
The mask regions are defined as follows:
- Top region: The maximum expected value. Voltages exceeding this value will fail.
- Middle Region: The size and shape of the eye diagram as defined by the interface standard for the high speed digital signal.
- Bottom Region: The minimum expected value. Voltages below this value will fail.
Measurement of Eye Diagram
Eye pattern can be created using following methods :
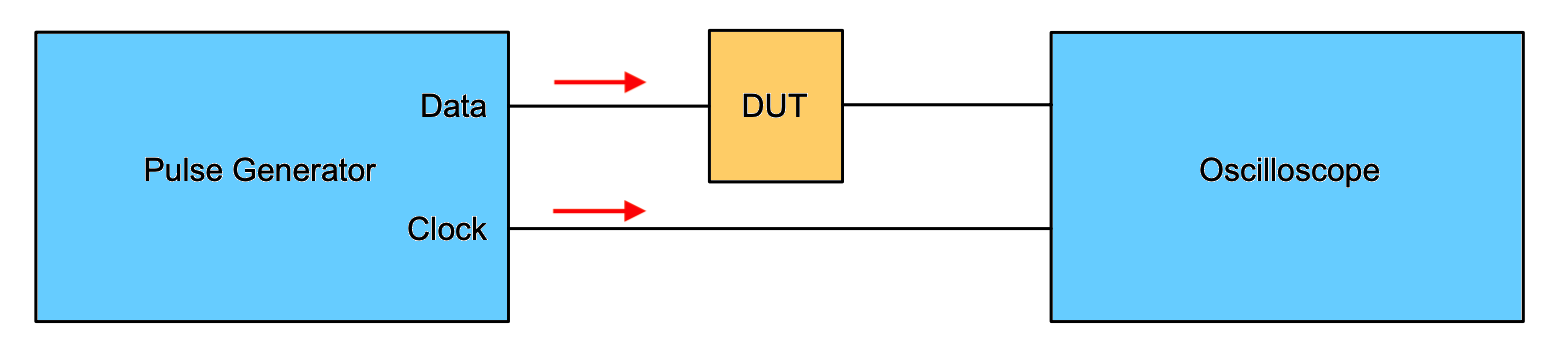
Using Sampling oscilloscopes
A high frequency sampling scope along with external pattern generator can be used as shown below :
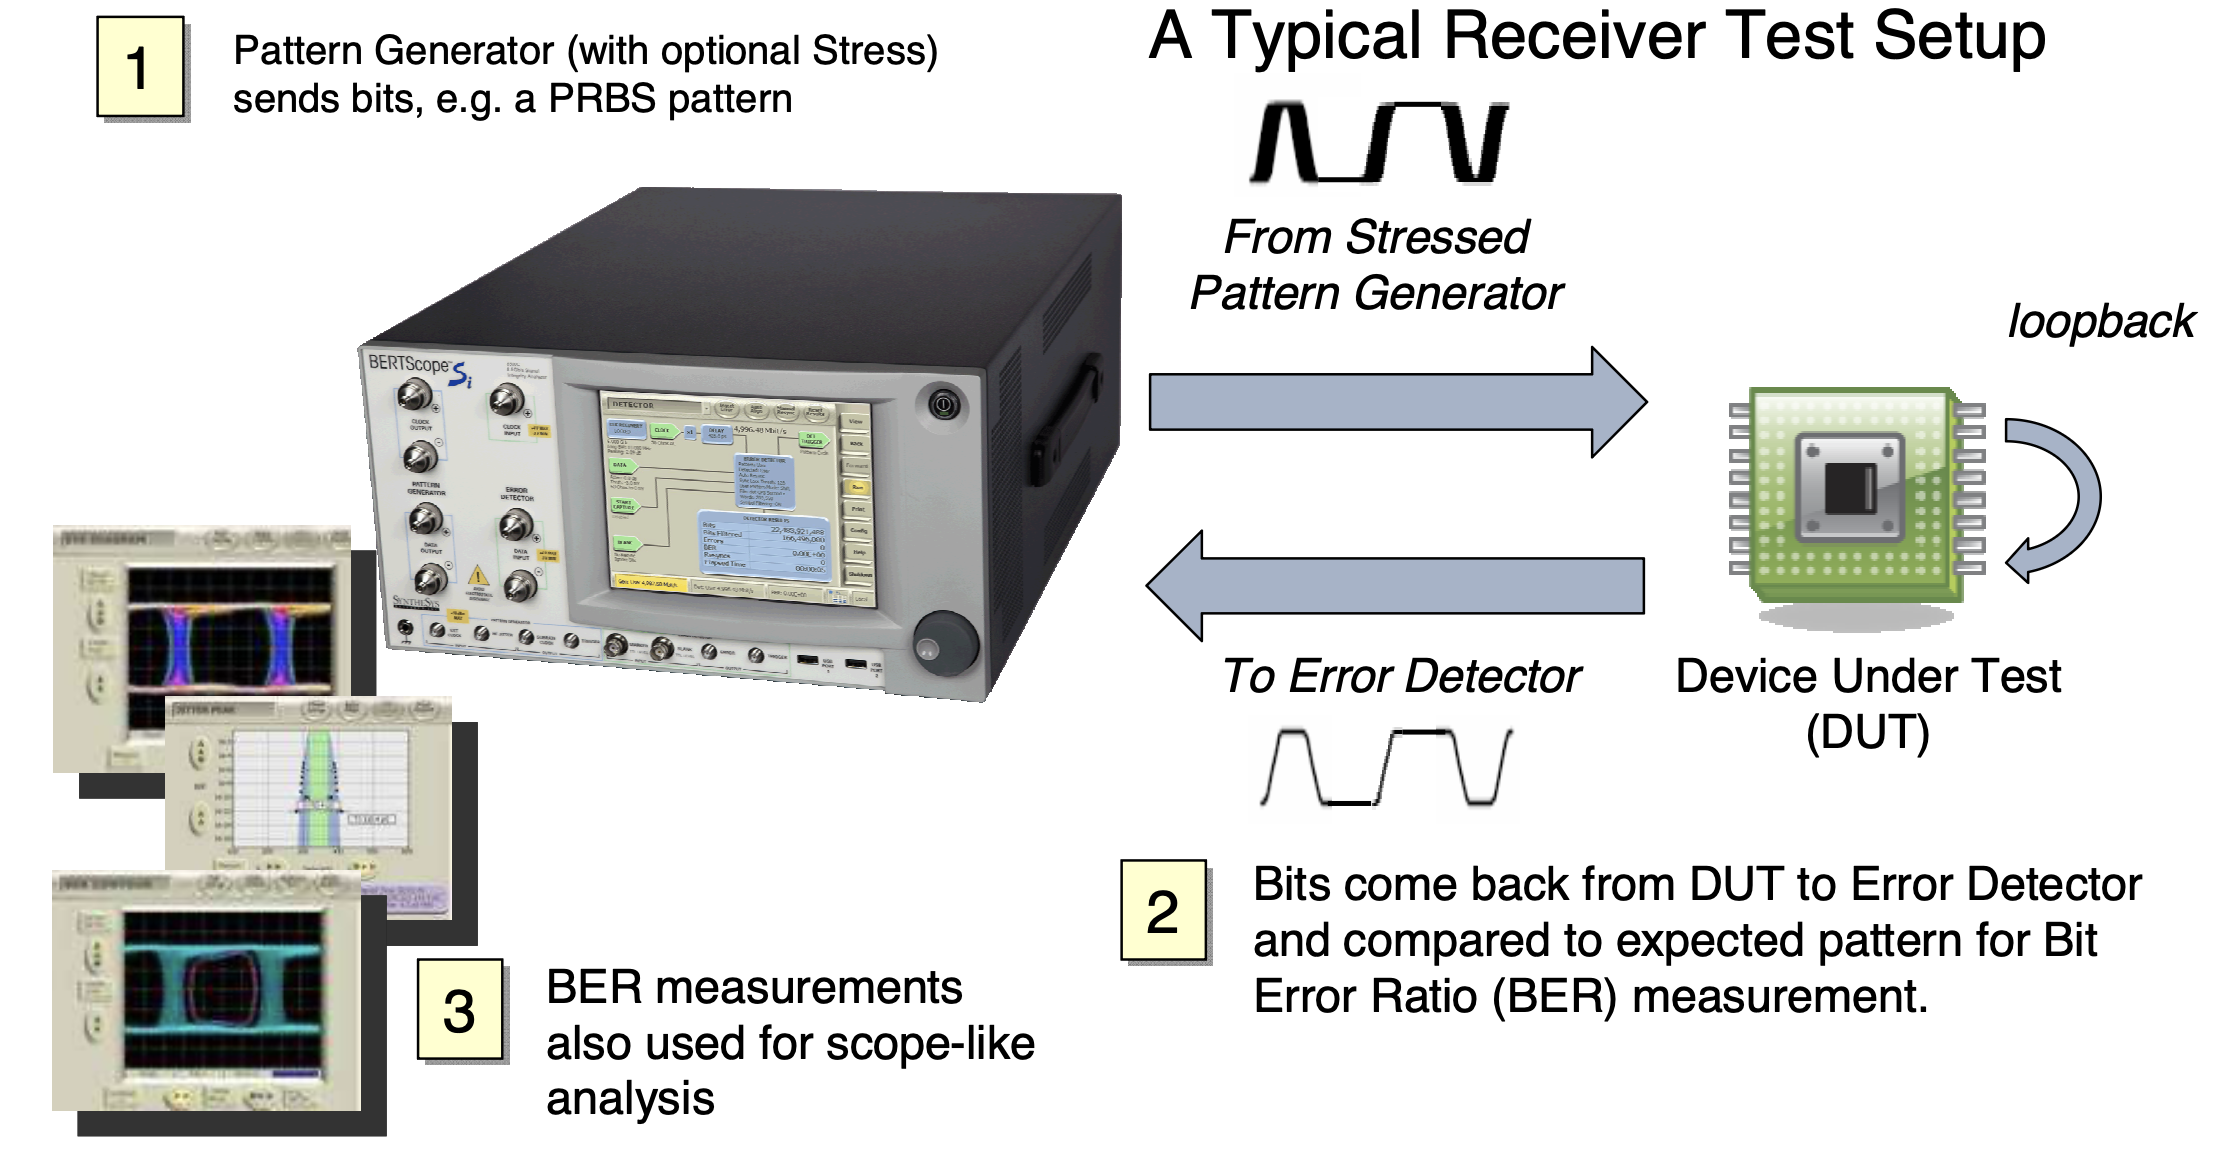
Using BERT oscilloscopes
A Bit error rate tester has a in-built pattern Generator (with optional Stress) and a scope to do BER measurements. BERT Scope are capable of perhaps three orders of magnitude more depth than sampling scopes.