Nyquist Stability Criterion
A Nyquist plot is a frequency response graph that helps engineers check if a control system is stable. For each frequency point in the s-plane, the complex number representing the transfer function is often represented in polar form (magnitude and phase angle). The magnitude indicates the gain or amplification, and the phase angle indicates the phase shift introduced by the system at that frequency. The polar representations of the transfer function are then plotted on the complex plane. It is called a Nyquist plot because the path (contour) used to plot the polar plot is called Nyquist contour.
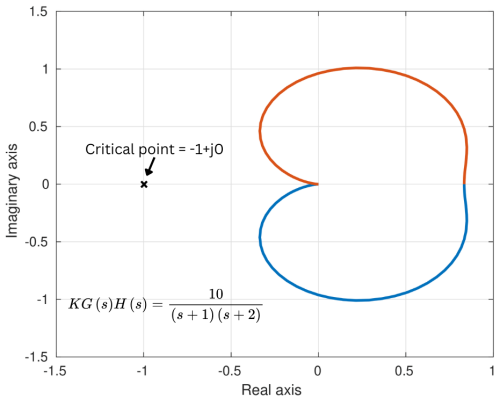
Nyquist stability criteria
If the Nyquist plot of the open-loop transfer function G(s)H(s) corresponding to the Nyquist contour in the s-plane encircles the critical point (-1+ j0) in the counterclockwise direction as many times as the number of right half s-plane poles of G(s)H(s), the closed-loop system is stable. In the commonly occurring case of open-loop function G(s)H(s) with no poles in the right half s-plane, the closed-loop system is stable if the Nyquist plot of G(s)H(s) does not encircle the -1+ j0 point.
Let's understand the above statement better in the following sections.
Understanding Nyquist stability criteria through example
A Nyquist plot is used to define Nyquist stability criteria. The idea is to check if the closed loop transfer function has poles in the right half plane of the s-domain. The roots of the characteristic equation are the poles of the closed-loop transfer function.

The closed-loop transfer function is:
$$\cfrac{y(s)}{x(s)}=\cfrac{K(s)G(s)}{1+K(s)G(s)H(s)}$$
The system is stable only if all the poles of the closed function lie in the left half plane. A single root in the right half plane will make the system unstable no matter how many roots lie on the left half plane. The roots or zeros of equation 1+K(s)G(s)H(s) are the poles of the closed-loop transfer function. Determining directly the closed loop roots of the characteristic equation could be difficult so we try to derive the stability by using the loop-gain K(s)G(s)H(s) alone.
To understand the Nyquist criteria, let's assume:
$$K(s)G(s)H(s)=K\cfrac{(s+z_1)(s+z_2)\dots{}}{(s+p_1)(s+p_2)\dots{}}$$
and
$$1+K(s)G(s)H(s)=\cfrac{(s+z_{1c})(s+z_{2c})\dots{}}{(s+p_1)(s+p_2)\dots{}}=F(s)$$
In reality, we won't know the actual values of closed-loop zeros -z1c, -z2c, etc but there is a way to know whether they lie on the right side of the F(s)-plane or sF-plane using Nyquist plot. We can rewrite the above equation as:
$$F(s)=\cfrac{(s+z_{1c})(s+z_{2c})\dots{}}{(s+p_1)(s+p_2)\dots{}}=\sigma{}_F+j\omega{}_F$$
We can say that F(s) is a transformation function that translates the s = σ + jω plane to the sF = σF + jωF plane. Let's build the tools and note some observations to take out the right half-plane roots/zeros of the characteristic equation.
Number of encirclements in Nyquist plot
We can observe the path of encirclement in the sF-plane due to a contour in the s-plane. Let's say the contour of the s-plane encircles n-poles and m-zeros of F(s):
$$F(s)=\cfrac{(s+z_{1c})(s+z_{2c})\dots{}}{(s+p_1)(s+p_2)\dots{}}=\cfrac{r_{z1}e^{j\phi{}_1}\cdot{}r_{z2}e^{j\phi{}_2}\dots{}r_{zm}e^{j\phi{}_m}}{r_{p1}e^{j\theta{}_1}\cdot{}r_{p2}e^{j\theta{}_2}\dots{}r_{pn}e^{j\theta{}_n}}$$
$$F(s)=\cfrac{r_{z1}r_{z2}\dots{}r_{zm}}{r_{p1}r_{p2}\dots{}r_{pn}}e^{j(\phi{}_1+\phi{}_2+\dots{}-\theta{}_1-\theta{}_2-\dots{})}$$
We observe from the mathematics that the angles of all the zeros is added and the angles from all the poles are subtracted. The above-simplified equation can be translated into the graph as follows (Fig 3). Kindly ignore the distance from the origin (in sF-plane), let's focus only on the angle as it will allow us to count the number of encirclements.
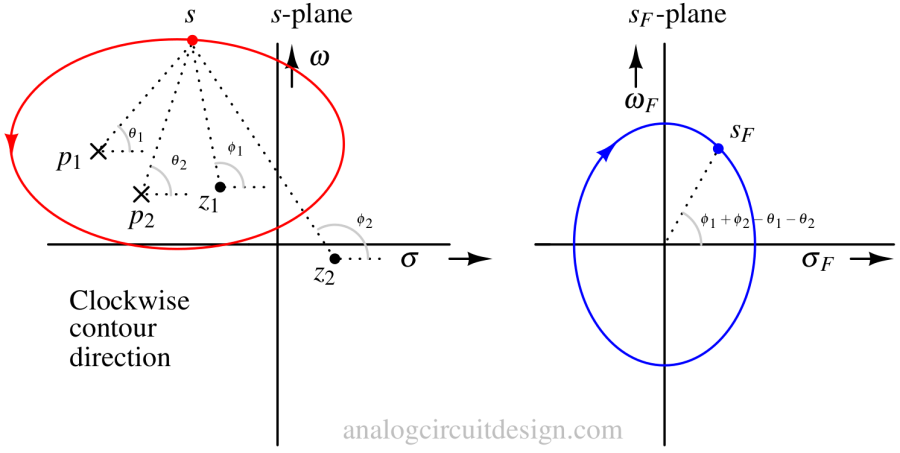
Encircling a zero of the F(s) in the s-plane in a clockwise direction means encircling the (0,0) in the sF-plane in a clockwise direction. Encircling a pole of F(s) in the s-plane in a clockwise direction means encircling the (0,0) in the sF-plane in a counter-clockwise direction. This is because the angle of poles is being subtracted from the phase in the sF-plane.
If we encircle m-zeros and n-poles in the s-plane clockwise, we can say that we will encircle the zero in the sF-plane m-n times clockwise, or n-m counterclockwise. In other words, we can say that if we have m-n encirclements of the sF-plane in a clockwise direction, it means we have m-n more zeros than poles in the right half plane.
For example, in the case shown in Fig 3, the contour encloses 2-poles and 1-zero in a clockwise direction. 1-zero of the system lying outside the contour. The contour in the sF-plane will encircle the (0,0) only once in a counter-clockwise direction.
What is a Nyquist Contour?
The Nyquist contour is a closed contour in the s-plane which completely encloses the entire right-hand half of the s-plane. This contour is drawn to catch the right half-plane roots of the characteristic equation. As we saw in the previous section, if a contour in the s-plane has m-n more zeros than poles in the right half plane, the Nyquist plot will encircle the (0,0) in a clockwise direction (m-n) times.
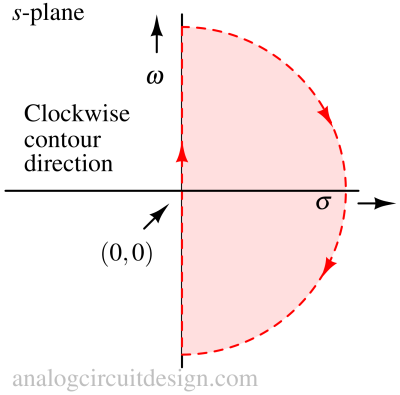
As shown in the above figure, the Nyquist contour starts from 0 to ∞ in ω-axis then sweeps clockwise covering the entire right-half-plane and comes back from -∞ in ω-axis to 0. In complex plane like s-plane, the term "contour" refers to a closed curve with a specific parametric equation that describes how to navigate the curve. More simple, a contour is a ordered set of points in s-plane. Why ordered? Because we need to have a sense of direction of the contour.
Behaviour of a root/zero of characteristic equation in Nyquist plot
Let's take a very simple example of a characteristic equation being F(s)=1+z1c and F(s)=1-z1c. In both cases, z1c is a positive valued real number. In the first case, the root of F(s) lies in the left-half-plane while in the second case the root of F(s)=0 lies in the right-half-plane. Let's see their individual behavior in Nyquist's plot.
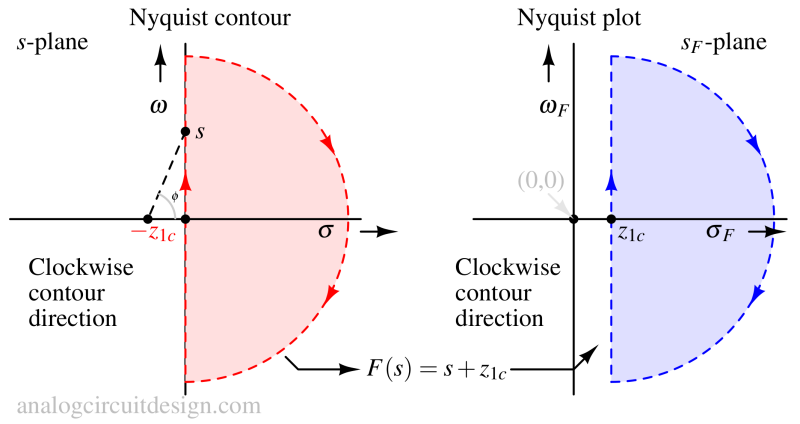
In the above figure, if we map the Nyquist contour on F(s) = s + z1c function, we see that the Nyquist contour does not enclose the zero -z1c. So, the Nyquist plot does not enclose (0,0) in the sF-plane.
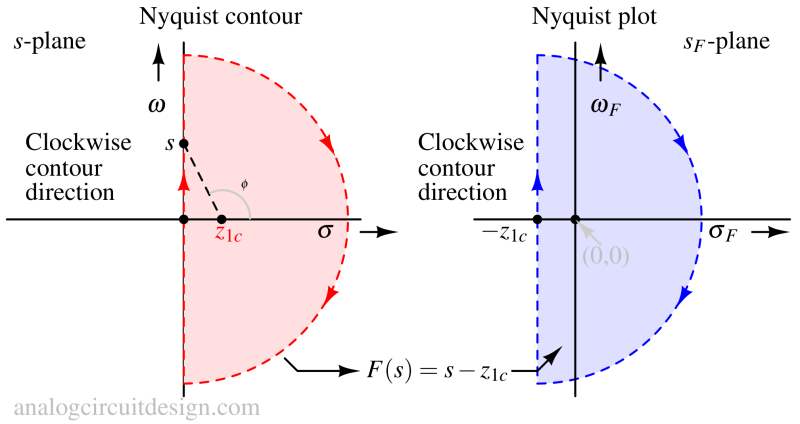
In the above figure, if we map the Nyquist contour on the F(s) = s - z1c function, we see that the F(s) contour encloses the root (z1c). So, it encloses (0,0) in the sF-plane.
Critical point (-1+j0)
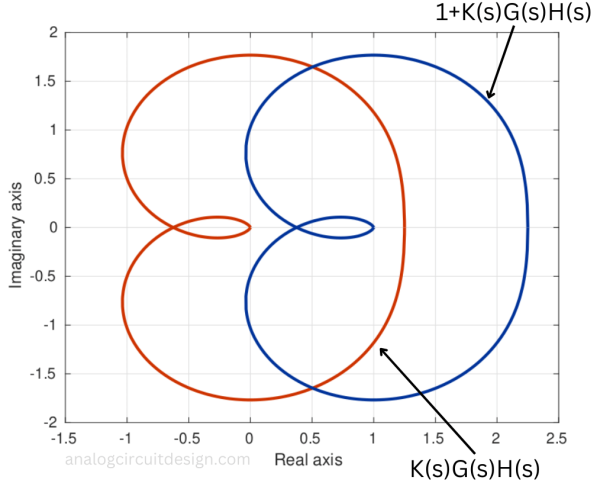
Till now we were analysing 1+K(s)G(s)H(s)=0. For this expression, we observed encirclement around point (0,0). It becomes difficult to draw the Nyquist plot from open loop transfer function if we use the expression 1+K(s)G(s)H(s). However, if we can use open-loop transfer function alone, it simplifies the drawing procedure. We observe from the Fig 6 that the Nyquist plot has shifted by 1 unit in left hand side. Now, instead of looking for encirclement of (0,0), we need to look for encirclement of (-1,0). We will still measure the angle from (0,0) in sF-plane.
Procedure to draw Nyquist contour
We shall use an example of K(s)G(s)H(s) to understand the procedure to plot a Nyquist plot.
$$K(s)G(s)H(s)=F(s)=\cfrac{3}{(s+2)(s-1)}$$
We can start with s=0. Putting the value s=0 in K(s)G(s)H(s), we get -3/2. This means the curve will start from -3/2. The start angle is -180°. Let's traverse the upper portion of the Nyquist contour first. The lower portion will generate a mirror image in the Nyquist plot. By putting ω→∞ we see that F(s)=0 again with -180°.
The angle of F(s) can be written as:
$$\angle{}F(s)=-\tan{}^{-1}(\omega{}/2)+\tan{}^{-1}(\omega{})-\pi{}$$
To find the maximum/minimum angle, we can differentiate the above equation with respect to ω. The maximum angle that would be achieved is -200°. The plot will look like Fig 7. The dashed line is the mirror image of solid portion. The dashed line represents the bottom half of Nyquist contour.
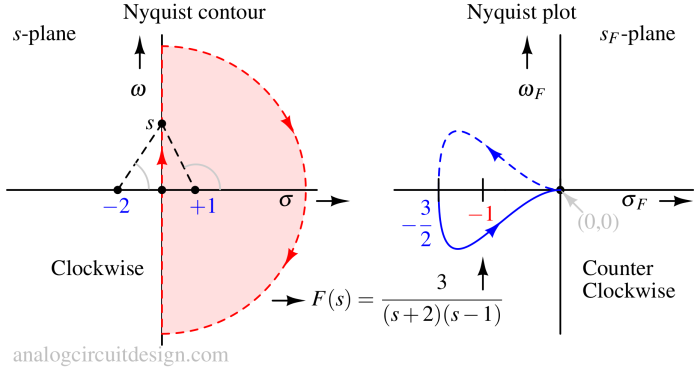
From the above plot, we see that the number of encirclement of point (-1,0) is one time in the counterclockwise direction. That means Z - P = -1. Why minus sign? Because of counter-clockwise Nyquist encirclement. We know that there is one RHP pole in open loop function F(s). That means P=1. So,
$$Z-1=-1\implies{}Z=0$$
This means the number of zeros of 1+F(s) lying in RHP is zero. So, the closed-loop system is stable even if the open loop system is unstable.
Matlab code for Nyquist plot
%% Nyquist plot
clear;
KP=3;
Gs=tf(1,[1 2])*tf(1,[1 -1]);
Hs=tf(1);
Ks=tf(KP);
ol_sys=Ks*Gs*Hs;
nyquist(ol_sys);